How to analyze check-in cycle data
To supplement the summary data available on the Check-ins page, you can download detailed check-in cycle engagement data as a CSV file. For instructions on how to do so, check out our article on How to export check-in cycle data.
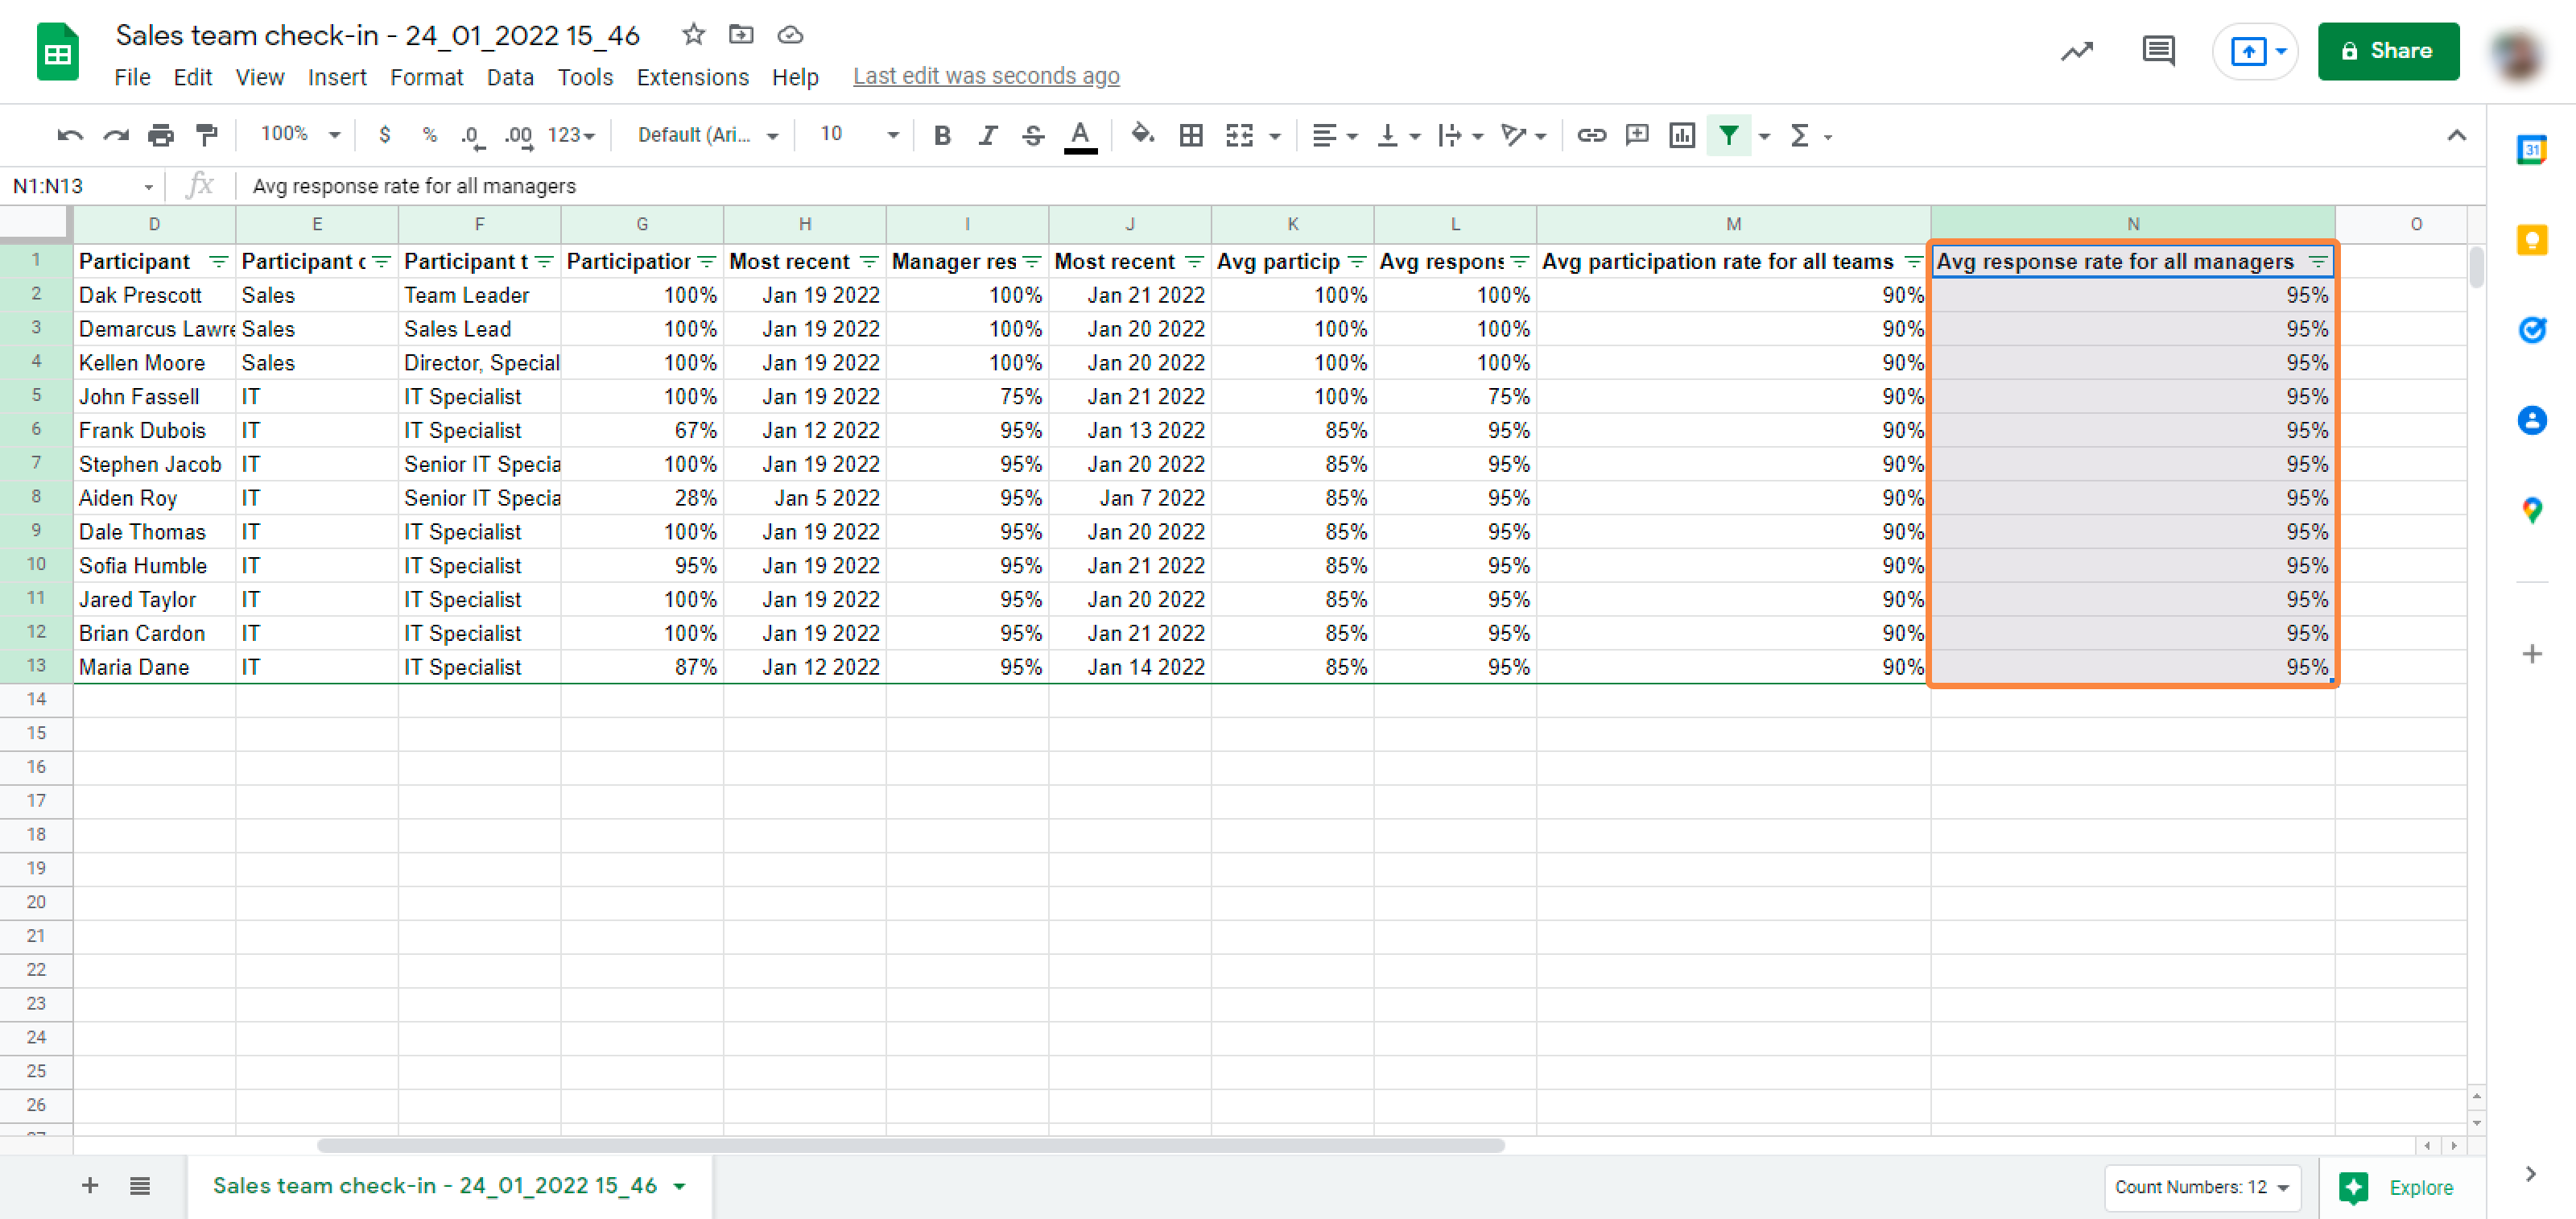
You can open the CSV file with any spreadsheet application to sort, filter, and organize metrics for that check-in cycle. We’ve included some examples below to show you how the data can be analyzed.
1. Open the file in your spreadsheet application of choice. Note that filtering and sorting functions may differ from application to application.
2. To review the engagement data for a specific manager’s direct reports, filter the spreadsheet by Manager.
3. To review a specific employee’s check-in cycle engagement data, filter the spreadsheet by Participant.
4. You can also see which employees are engaging the most (and the least) by filtering the spreadsheet by Participation rate. Employees with poor participation rates may be disengaged or need more support from their manager.
5. To view the average participation rate for all teams across this check-in cycle, consult the value in the Avg participation rate for all teams column.
6. To view the average response rate for all managers across this check-in cycle, consult the value in the Avg response rate for all managers column.